retail-forecast.
A promo lifts a Rossmann day by 38.8%
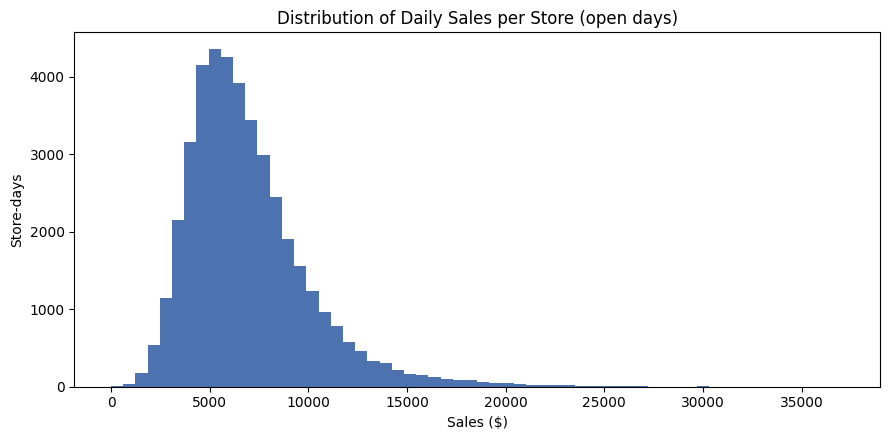
Daily sales analysis and forecasting for 1,115 Rossmann drugstores (844,392 open-day records, 2013-2015) in PySpark: eight charts on seasonality and promotions, then a Random Forest with per-store target encoding, tested honestly on the two months it has never seen.
844,392
open-day records · 1,115 stores · 2013-2015
+38.8%
average sales lift on promo days ($5,929 → $8,228)
$886
MAE per store-day on the unseen Jun-Jul 2015 window
0.837
R² · RMSE $1,256 · 58,611 test rows
Tech Stack
The brief · problem → approach → result
01 / The problem
A drugstore chain plans staffing, logistics and stock per store per day. To do that well it needs to know what a typical day looks like, what promotions are worth, and how predictable daily sales really are from store attributes and the calendar alone.
02 / The approach
Take the public Rossmann Store Sales dataset (844,392 open-day records across 1,115 stores, 2013-2015), join the store attributes, read the seasonality in eight charts, then train a PySpark Random Forest with a per-store target encoding and test it on the two months it has never seen.
03 / The result
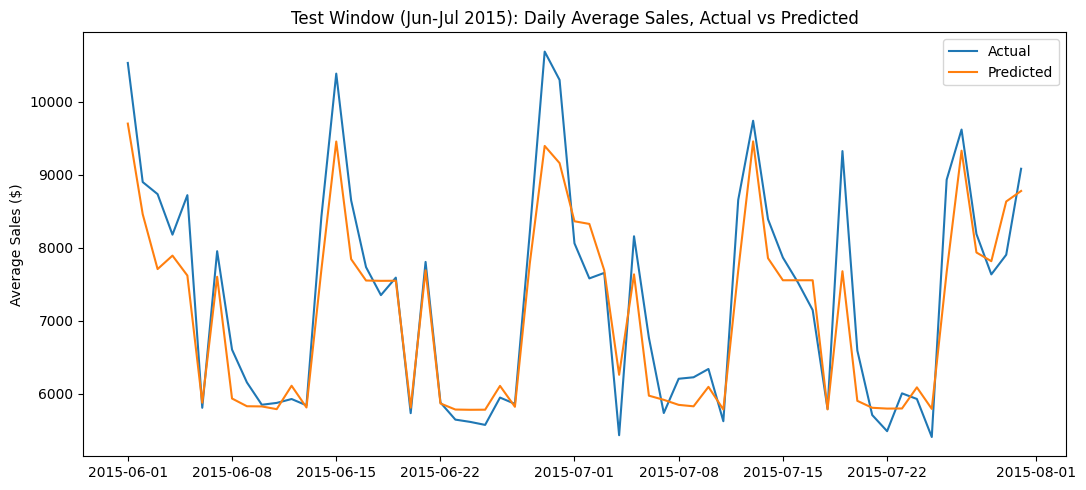
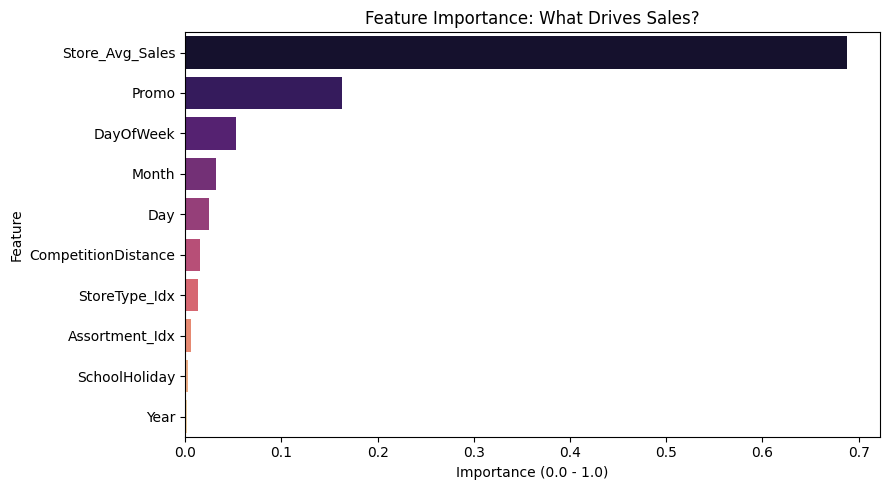
Promotions lift an ordinary day by 38.8% and the calendar gives the model its rhythm. On the unseen June-July 2015 window the model lands at MAE $886 per store-day (R² 0.837), with the store's own baseline dominating feature importance, followed by promotion and day-of-week.
The Pipeline
Load & Join
1.1M rows ⋈ store table
Features
calendar parts from Date
Split
temporal: past → future
Encode
per-store average, train only
Evaluate
MAE / RMSE / R² on unseen data
The split comes first and the encoding comes after it: the model only ever learns store averages from the training window, so no information from June and July 2015 can leak into the features. One-hot encoding 1,115 stores would blow up memory in Spark, so each store is represented by its historical average instead, with the global mean as a fallback for stores unseen in training.
What It Answers
Pattern
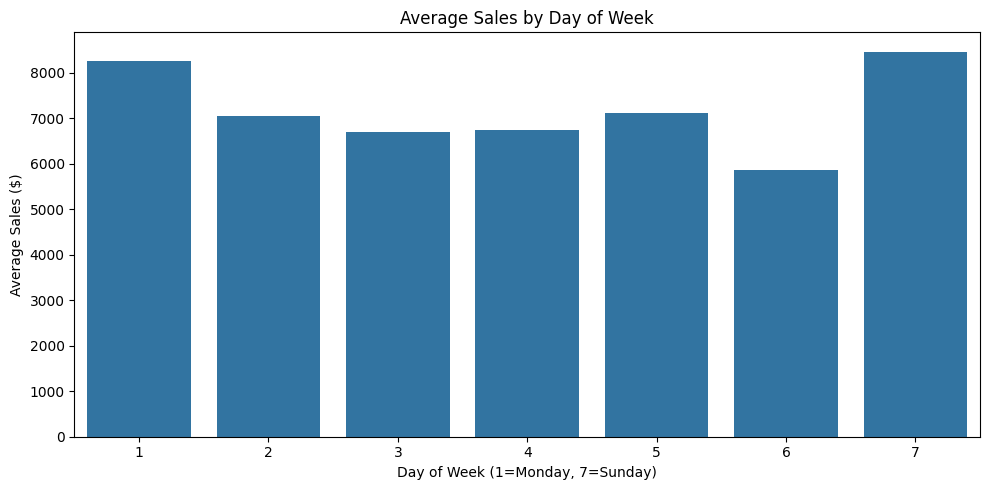
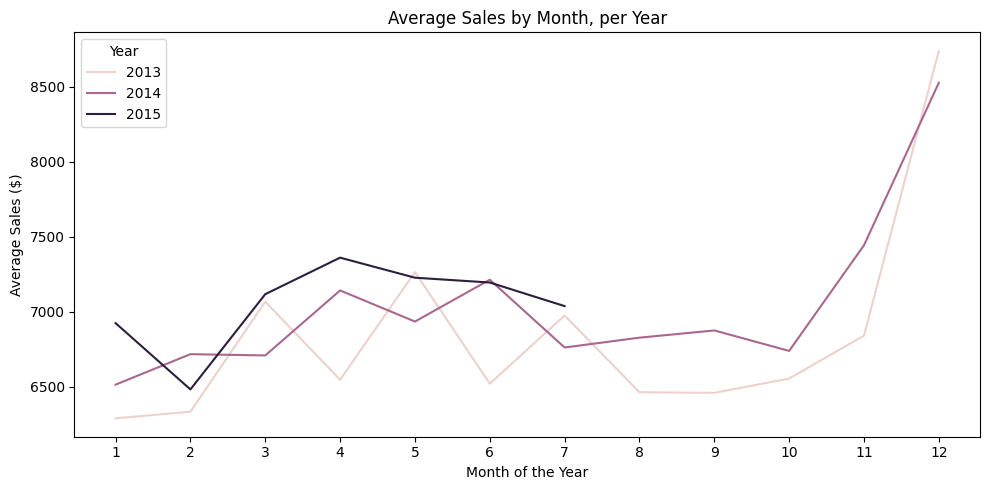
Both seasonalities are strong. Most stores close on Sundays, so demand piles up into a Monday spike, and every year peaks in November and December around Christmas shopping. The pattern repeats cleanly across 2013, 2014 and 2015.
Promotion
Promo days average $8,228 in sales against $5,929 without, a +38.8% lift on an ordinary day. The grouped chart shows the lift holding for every store type, so promotions are not just a big-store effect.
Forecast
Trained on everything before June 2015 and tested on the two unseen months after, the Random Forest with per-store target encoding reaches MAE $886, RMSE $1,256 and R² 0.837. Feature importance is led by the store baseline, then promotion and calendar.
Honest By Construction
Guards that keep the test honest
- 01Temporal split: train ends May 2015, test is the unseen June-July window.
- 02Target encoding fit on the training window only, never the full data.
- 03Stores unseen in training fall back to the global mean instead of nulls.
- 04Categorical indexers are fitted on train, so the test set cannot add labels.
What the model cannot say
Not autoregressive
There are no lag features, so the model cannot use yesterday's sales. The natural upgrade is lags plus rolling validation.
A baseline, not a leaderboard entry
This is an end-to-end business analysis with a fixed feature set. Its metrics are not comparable to competition submissions that use extra data.
One model, no tuning
A 20-tree Random Forest with default-ish depth. It answers the business questions; squeezing the last percent of error was not the goal.
Built on the public Rossmann Store Sales competition dataset. The notebook is the single source of truth: research questions, method, figures, findings and limitations all live in one place, rerunnable top to bottom.
Inside The Notebook
retail-demand-forecasting-rossmann-pyspark/
├── Research Questions          # 3 business questions up front
├── 1. Load & Join Data         # transactions ⋈ store attributes, open days
├── 2. Features                 # Year / Month / Day split from Date
├── 3. EDA & Visualization      # 8 charts: seasonality, promo, distribution
├── 4. Model                    # temporal split → target encoding → RF
└── 5. Evaluation & Conclusion  # metrics on unseen Jun-Jul 2015, answers
The Figures